Wednesday, April 4, 2012

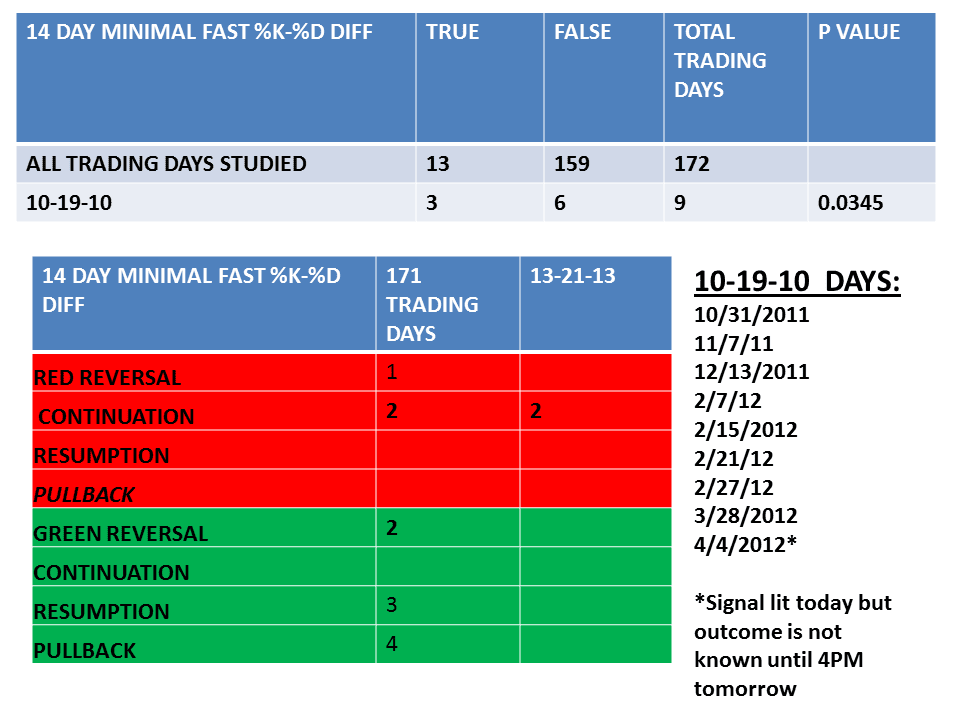
10-19-10 Fingerprint Today (Updated)

Five (all Red TZA Continuations) of eight down the next day. The other 3 days were Green Pullback (2) or Resumption (1) Days within a downtrend. There were five Bearish 3 Inside Down Days. Two were associated with a subsequent big down day that represented a Green Reversal (11/1/11 & 12/14/11). From Americanbulls.com: Definition: The Bearish Three Inside Down Pattern is another name for the Confirmed Bearish Harami Pattern. The third day confirms the bearish trend reversal. Recognition Criteria: 1. Market is characterized by uptrend. 2. We see a Bearish Harami Pattern in the first two days. 3. We then see a black candlestick on the third day with a lower close than the second day. Explanation: The first two days of this three-day pattern is a Bearish Harami Pattern, and the third day confirms the reversal suggested by Bearish Harami Pattern since it is a black candlestick closing with a new low for the three days.

Tuesday, April 3, 2012

13-21-5 CONVERTS TO 13-21-13

This fingerprint was followed by down days 3 of 4 times since last summer. Expecting another pullback day analogous to 9/8/11.

13-21-5

When TNA is down for the day today's fingerprint is 13-21-5 (2 prior instances in past 170 trading days). When TNA rises above 0% for the day the fingerprint becomes 12-24-5 (3 prior instances in past 170 trading days). Each of those five days were followed by an up day.

Monday, April 2, 2012

2-20-2 GRID FINGERPRINT EOD

Selected Signals that lit today are statistically correlated with today's 2-20-2 fingerprint. TNA's 3LB chart does not correlate with 2-20-2 days.

11-20-3 GRID has evolved into 2-20-2 GRID

Taking profits today since 2-20-2 can be either green continuation or red pullback day after a Green Reversal. The first number is the PVI 3LB GRID. The middle number (i.e. 20) is the PVI Demarkian GRID. The last number is the mode of all the 3LB GRIDS.

As of 10:30AM GRIDS Suggest More Up 2moro

11-20-3 today. A Green Reversal is usually followed by an 11 or 2.

Sunday, April 1, 2012

17:19:1/17:19:7=?3:19:3

The 17:19:1 or 7 fingerprints are resumption predictors (e.g. 17 is the PVI 3LB GRID, 19 is the PVI DEMARKIAN GRID AND 1 and 7 are the MODE OF 3LB GRIDS). Many of the DeMarkian GRIDS for those two days in January and the past trading day are very similar. Similar GRIDS included Awesome Oscillator, CLOSE LOCATION VALUE, MACD-SIGNAL LINE DIFF, RSI/ HA RSI, STOCH RSI(14)/ HA STOCH RSI (14), PVI, CLOSE - TYPICAL PRICE & HA CLOSE-HA PLDOT.