Friday, July 30, 2010

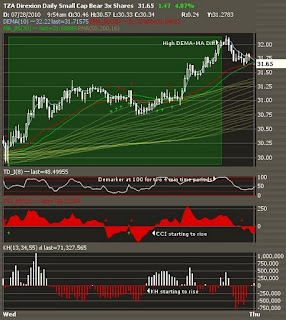
Analysis of July 30th


Blue-gray ovals are consolidation periods (little teeth on the KH & AO charts; TSI ambling along the zero line; red & green arrows battling it out on the TZA 4 min Price & CCI charts; tangled MA lines on the TZA 4 min price chart). Green rectangles are TZA hold periods. Grey rectangles are TNA hold periods. A TZA buy is signaled when green arrows have occurred for both an MA and the CCI. Signals are supported by AO signals. See: http://www.alpari.co.uk/en/market-analysis-guide/chaos-theory/ao.html

Thursday, July 29, 2010

Price Target at End of 1st Trade


Please read post below first. There was a divergence between the Price and both the CCI and KH at the end of the 1st trade. A TZA price target was calculated as per Constance Brown's book. It landed up half way down the 2nd trade (a TNA trade; the first gray box).

Four Potential Trades off the 4 min TZA Chart


Successfully executed the 1st and 4th trade (in green) today on the 4 minute TZA chart.
Summary of potential trades:
1. MA and CCI both broke out (little green arrows) in 10:18 AM Period: Buy TZA. This was followed by consolidation (green & red arrows battling it out until the 10:54 Period). Sold during the 12:02 Period as DEMA got way ahead of the MA & EMA and the Demarker plus the TSI went over 136.

2. Red MA and CCI breakout arrows leading into & during the 12:54 Period suggesting a TNA Buy. DEMA initially crosses thru the MA & EMA and subsequently gets way below the MA & EMA. TSI continually falls until it turns back up at ~-25 signalling a TNA Sell. Demarker bottoms out earlier and then bounces below or just above the lower red signal line (i.e. 20).

3. Same as 2, except DEMA starts out below the MA & EMA and the TSI turns back up around -33.5.

4. Same as 1 except trading session ends before things get completed.

Using the Demarker & TSI to Nail the Sell


See: https://www.tradestation.com/discussions/Data/2002125162918_AT-TSI%20JAN2002.pdf for an explanation of the True Strength Index. When the Demarker plus the TSI is over 138 it's time to sell the run...see disclaimer above...

Wednesday, July 28, 2010

Typical Market Profile Day


TZA was held throughout most of the day. The 5 minute TZA chart did not signal a buy for the first half of the day. The 4 minute chart signaled a buy during the 9:38 period. The market progressed upwards in a methodical fashion with occasional pullbacks (especially after the DEMA had moved up & away from the MA & EMA). It was elected to hold TZA for most of the day. TZA was sold during the 3:10PM time period, since: 1. the DEMA-MA spread had widened; 2. the Demarker topped out at 100 for 2 successive periods and 3. the mid-day consolidation period (with all the red and green arrows battling it out) lasted more than the 50 minutes that was left in the trading session. Could have had a slightly longer mid-day nap...

Tuesday, July 27, 2010

One Thru Five Minute TZA Overlay


TZA broke up through its MA Ribbon on the one & two minute charts. Here is TZA's Two Minute Chart from today with an overlay of the TZA Buy Signals from the one (tan), two(brown), three(aquamarine), four(green) & five (purple) minute charts. With the exception of the early morning run-up, more extensive TZA run-ups were concentrated around the three to five minute chart buy signals.

Saturday, July 24, 2010

Five Day TNA & TZA


A drop in the CCI does not trigger a sell order. A MA Red Arrow, Demarker drop or Klinger Histogram drop do trigger a sell order.

Friday, July 23, 2010

Three Up Trades Today


There were 3 TNA buy signals today all on the 5 minute chart.
For example: Signal one evolved between the 2 blue lines. The Klinger Histogram(KH) was in the red in the lowest panel and started upticking (2 olive arrows). There were MA & EMA breakout signals (small green arrows) along with a CCI breakout signal (small green arrow). The signal was confirmed by the DEMA crossing up through the other 2 Moving Averages (blue arrow). The sell signal between the 2 orange lines included downticks in the Demarker, CCI & KH (pink & black arrows). The sell signal was confirmed by a flattening of the DEMA (orange arrow).

Wednesday, July 21, 2010

2Z Rang Today


2Z= THE TRIGGER LINE IS POSITIVE, AND ABOVE THE KVO LINE, THE KVO IS FALLING, THE DEMARKER IS IN MID-RANGE AND FALLS, THE CMF IS MIDRANGE AND FALLS, THE AO IS RED, POSITIVE AND SHRINKING rang in the 13:40 Period.
OPEN LOW
38.58 38.53
38.53 37.6999 (2.28%)
2Z=AND(H1871>0.126,H1871<2.949,K1871>221378,K1871<1467929,L1871>42.08,L1871<70.2,M1871>-0.097,M1871<0.073,CA1870>0.045,CA1871<-0.189,J1871J1871), where CA1871=(J1871-K1871)/K1871. See prior posts for definitions of H, J,K,L & M.

Daily Kagi Also Bullish


We may get another upleg before we go down (the TNA Weekly Kagi remains bearish)...

Monday, July 19, 2010

SPX Bouncing Off Cloud Boundary

TZA Should Run Up More


The chart is busy with a variety of components:
1. TZA is plotted with Equivolume Charting. TZA's volume has been increasing and TZA has been displaying Power Boxes. see: http://instigator928.blogspot.com/2009/09/weekly-equivolume-candlevolume-charts.html
2. TZA peaks when the SAR dots are below it and there is alot of green above from the Chaikin Money Flow(CMF), Money Flow Index(MFI) & Force Index. This has not occurred yet.

What's Still Bullish?


1. The Daily Tick 3 Line Break. It's been positive since March 10th 2009. (Note: The daily & weekly Tick Kagi's are negative; the weekly Tick 3LB went negative in November 2009)

22Z Rang Thrice Today


22Z=RISING OPEN, RISING AO FOR 2 PERIODS, GREEN AO FOR 2 PERIODS, RISING KVO LINE, KVO LINE>TRIGGER LINE, RISING DEMARKER & CMF, ABSOLUTE DEMARKER DIFF/PRIOR ABSOLUTE DEMARKER DIFF<0.15, ABSOLUTE CMF DIFF/PRIOR ABSOLUTE CMF DIFF<0.15, ABSOLUTE KVO LINE DIFF/PRIOR ABSOLUTE KVO LINE DIFF>3.7, ABSOLUTE AO DIFF/PRIOR ABSOLUTE CMF DIFF>2, ABSOLUTE KVO TRIGGER LINE DIFF/PRIOR ABSOLUTE KVO TRIGGER LINE DIFF>2.19, WEIGHTED DEMARKER DIFF MOVING AVERAGE> SIMPLE DEMARKER DIFF MOVING AVERAGE, (PRIOR KVO LINE)*(KVO LINE-KVO TRIGGER)/KVO TRIGGER*(KVO LINE DIFF)>-3.51 & less than 3.71 rang during the following three periods: 9:50AM, 11:20AM & 11:50AM
OPEN LOW
10:00 36.45 35.84
10:10 35.86 35.7 (2.06%)
11:30 35.56 35.23
11:40 35.23 35.14(1.18%)
12:00 35.57 35.14
12:10 35.33 35.14(1.21%)
Breeding Plumage American Goldfinch, Unami Lane, Center for Discovery with Randy & Lauren 7/18/10

Low Pole Reversal on TZA P&F


From stockcharts.com: "The low pole reversal is seen when a chart falls below a previous low by at least 3 boxes but then reverses to rise by at least 50 percent of the fall. The reversal implies that the supply that was making the prices fall has been absorbed and demand is taking over. The pattern is an alert that higher prices could be seen in the future. The ideal buy point would be on another reversal back down to be closer to the stop loss point. This would also set up a double top breakout if the prices reverse up and break over the current column's high."

Sunday, July 18, 2010

$SPXA200R Less Than 50


As per John J. Spille, the market is in trouble when less than 50% of S&P stocks are above the 200 MA.

Saturday, July 17, 2010

TZA Darvas Breakout


See: http://www.sethi.org/investments/darvas/

TNA Ichimoku Bounces Off Red Standard Line


TNA bounces off the Red Line below the cloud. The Blue Turning Line is below the Red Standard Line. This is Bearish for the Market.

Tenkan-sen (Turning Line): (9-period high + 9-period low)/2: On a daily chart, this line is the mid point of the 9 day high-low range, which is almost two weeks.

Kijun-sen (Standard Line): (26-period high + 26-period low)/2: On a daily chart, this line is the mid point of the 26 day high-low range, which is almost one month.

TZA Buy on American Bulls Candlestick Analysis


http://americanbulls.com/StockPage.asp?CompanyTicker=TZA&MarketTicker=NYSE&TYP=S

TZA
SMALL CAP BEAR 3X SHARES
Daily Commentary

Our system posted a HOLD today. The previous BUY recommendation was issued on 07.15.2010 (1) day ago, when the stock price was 34.4900. Since then TZA has gained 13.86% .
Attitude at 1999 International Skeeter Association Regatta

Friday, July 16, 2010

8DZ Rang Today


8DZ=HIGHER ALLIGATOR DIFF(QQ):LOWER OPEN(D) BULLISH DIVERGENCE NEGATIVE REVERSAL rang during today's 10:20AM Period. The ALLIGATOR DIFF IS THE (LIPS-TEETH)/(TEETH-JAW). They lips, teeth & jaw Moving Averages were modified (see prior post).
The Divergence formula is AND(PX1734>-13.71,PX1734 less than 13.44,BZ1734less than 19.26,SN1734 greater than -2.209,SN1734 less than 1.174,BT1734 greater than -3.09,D1734less than D1732,D1733less than D1734,QQ1734 greater than QQ1733,QQ1734greater than QQ1732,QQ1733less than QQ1732), where PX1734=(BX1734*BY1734/BY1733), BX1734=BR1734/BS1734, BR1734=(J1734-K1734)/K1734, J is the KVO Line & K is the KVO Trigger Line, BS1734=(J1734-J1733)/J1733, BY1734=(H1734-H1733+0.0001)/H1733, H is the Awesome Oscillator, BZ1734=GU1734/GU1733, GU1734=ABS(L1734-L1733)+0.0001, L is the Demarker, SN1734=ROUNDDOWN(SLOPE(D1729:D1734,D1723:D1728),3), D is the period open, BT1734=BS1734/BS1733, QQ1734=(QO1734-QN1734)/(QN1734-QM1734), QO1734=AVERAGE(D1727:D1731), QN1734=AVERAGE(D1722:D1729), QM1734=AVERAGE(D1714:D1726).
The TNA target price was =ROUNDDOWN(D1733-(D1732-D1734),2)=37.4. TNA opened the 10:20AM Period at 38.0614 and reached the target price in the 12:10PM Period. TZA was bought & sold during these periods for ~ a 1.74% gain.
It's a kite photo of Attitude.

Daily TNA Three Line Break Goes Red

Thursday, July 15, 2010

23Z Rang During 3:20 PM Period


23Z=RISING OPEN, RISING AO FOR 2 PERIODS, GREEN AO FOR 2 PERIODS, RISING KVO LINE, KVO LINE>TRIGGER LINE, RISING DEMARKER & CMF, ABSOLUTE DEMARKER DIFF/PRIOR ABSOLUTE DEMARKER DIFF<0.15, ABSOLUTE CMF DIFF/PRIOR ABSOLUTE CMF DIFF<0.15, ABSOLUTE KVO LINE DIFF/PRIOR ABSOLUTE KVO LINE DIFF>3.7, ABSOLUTE AO DIFF/PRIOR ABSOLUTE CMF DIFF>2, ABSOLUTE KVO TRIGGER LINE DIFF/PRIOR ABSOLUTE KVO TRIGGER LINE DIFF>2.19, WEIGHTED DEMARKER DIFF MOVING AVERAGE< SIMPLE DEMARKER DIFF MOVING AVERAGE, (PRIOR KVO LINE)*(KVO LINE-KVO TRIGGER)/KVO TRIGGER*(KVO LINE DIFF) <1.66 OR AO DIFF<1.197, AO DIFF*(PRIOR KVO LINE)*(KVO LINE-KVO TRIGGER)/KVO TRIGGER*(KVO LINE DIFF) <1.78=AND(D1686>D1685,H1686>H1685,H1685>H1684,I1686=1,I1685=1,J1686>J1685,J1686>K1686,L1686>L1685,L1686<100,M1686>M1685,OR(ABS(L1686-L1685)/ABS(L1685-L1684+0.0001)<0.15,ABS(M1686-M1685)/ABS(M1685-M1684+0.0001)<0.15,ABS(J1686-J1685)/ABS(J1685-J1684+0.0001)>3.7,ABS(H1686-H1685)/ABS(H1685-H1684+0.0001)>2,ABS(K1686-K1685)/ABS(K1685-K1684+0.0001)>2.19),GP1686>GQ1686,(BR1686*BS1686/BS1685)<1.78,OR(BR1686<1.066,BS1686/BS1685<1.197)), where D is period open, H is awesome oscillator, I=1 means green AO, J is KVO Line, K is KVO Trigger Line, L is Demarker, M is Chaikin Money Flow, GP1686=(GO1686/GO1685+GO1686/GO1684+GO1686/GO1683)/3, GO1686=ABS(L1686-L1685)+0.0001, GQ1686=(3*GO1686/GO1685+2*GO1686/GO1684+GO1686/GO1683)/6.
TNA: D=OPEN LOW
15:30 41.72 41.4
15:40 41.42 41.1 (1.49%)

Monday, July 12, 2010

ROC Trading System Revisited


It signaled to buy TZA during the week of June 21th at 34.95.

TNA Ichimoku Pitchfork


The turning line ran right along the pitchfork.

Harami Time


Equivolume TNA Chart: Nice White Candle followed by a red spinning top and then down the slippery slope...

Friday, July 9, 2010

Nasdaq New High-New Lows 10 day Moving Average


The Nasdaq New High-New Lows 10 day Moving Average has been negative since mid-May. This was a signal to sell the Market. One should buy the Market when the MA goes positive (e.g. early April 2009). See http://stockcharts.com/def/servlet/Favorites.CServlet?obj=ID95481&cmd=show[s77697062]&disp=O for more signals from Henri Straetmans.

Thursday, July 8, 2010

Is this it?


The S&P has reached the Standard Line. Does the big drop begin now?

Tuesday, July 6, 2010

Numerous Bear MA-Bear Alligator Pounce Signals Today


The PERIOD OPEN <10 PERIOD MA <50 PERIOD MA <200 PERIOD MA & PERIOD OPEN < ALLIGATOR LIP less than TEETH less than JAW POUNCE AT THE OPEN BUY TZA rang numerous times today. The alligator formulas were modified from Bill Williams's book (they are reminicient of the lagging MA in Ichimoku charts). The formula for this signal for excel line 1441 is: =AND(PA1441>0.13,BN1441>-1.75,BL1440>-0.32,BM1441>-0.113,D1441 less than AVERAGE(D1432:D1441),AVERAGE(D1432:D1441) less than AVERAGE(D1392:D1441),AVERAGE(D1392:D1441) less than AVERAGE(D1242:D1441),AND(D1441 less than AVERAGE(D1438:D1441),AVERAGE(D1438:D1441 less than AVERAGE(D1433:D1440),AVERAGE(D1433:D1440)less than AVERAGE(D1425:D1437))), where D is the TNA 10 minute Period Open, BM1441=(J1441-J1440)/J1440, J is the KVO Line, BL1440=(J1440-K1440)/K1440, K is the KVO Trigger Line, BN1441=BM1441/BM1440, PA1441=ABS(L1441-L1440)/ABS(L1440-L1439+0.0001), L is the Demarker. Pounce means buy as soon as the signal rings and sell during the same period at the perceived low.
13:30 34.5864 34.13
13:40 34.1499 33.72
13:50 33.8297 33.41
14:00 33.49 33.8198 (2.22%)
14:50 33.61 33.22
15:00 33.2799 32.96
15:10 33.26 32.85
15:20 32.909 32.52 (3.24%)

Sunday, July 4, 2010

Tight Bull Flag on Friday


BULL TIGHT FLAG BUY TNA AT NEXT PERIOD OPEN & SELL AT HIGH 2 PERIODS LATER Signal rang in period 1409 7/2/2010 TNA 14:40PM. Formula is AND(OJ1409greater than 0.58,MAX(D1403:D1405)greater than MAX(D1406:D1407),MAX(D1406:D1407)greater thanMAX(D1408:D1409),MIN(D1403:D1405)less than MIN(D1406:D1407),MIN(D1406:D1407)less than MIN(D1408:D1409)). D is the TNA open for period and OJ1409=ABS(D1409-D1408+0.001)/ABS(D1408-D1407+0.0001).

7/2/2010 TNA 14:50 34.2 34.45
7/2/2010 TNA 15:00 34.41 34.68
7/2/2010 TNA 15:10 34.68 34.72 (1.52%)

Friday, July 2, 2010

May Get Short Relief Rally and Then DOWN


Here's 2 more reasons:
15. Weekly TNA Kagi went negative yesterday.
16. Daily TNA Kagi went negative yesterday.

Thursday, July 1, 2010

Signal 9D Picks Up Yesterday's AM TNA Run


9D= LOWER AO(H) DIFF [BK]:HIGHER OPEN(D) BEARISH DIVERGENCE POSITIVE REVERSAL rang in the 10:50 AM Period (line 1308). The formula is: =AND(D1308>D1306,D1307>D1308,BT1308 less than BT1307 and BT1308 less than BT1306,BT1307>BT1306,BO1308>-0.46,BO1308<1.629,OR(BS1308<-1.97,BS1308>15.09)). Target Price was 39.11. BT1308=(H1308-H1307)/H1307, where H is the AO. BO1308=BN1308/BN1307. BN1308=(J1308-J1307)/J1307, where J is the KVO Line. BS1308=BM1308/BN1308, where BM1308=(J1308-K1308)/K1308, where K is the KVO Trigger Line.
6/30/2010 TNA 10:50 38.51
6/30/2010 TNA 11:00 38.27
6/30/2010 TNA 11:10 38.21
6/30/2010 TNA 11:20 38.52
6/30/2010 TNA 11:30 38.24
6/30/2010 TNA 11:40 38.7 39.04
6/30/2010 TNA 11:50 39.01 39.1799
(39.11-38.51)/38.51=1.53%...Had a nice nap while the price ran up...