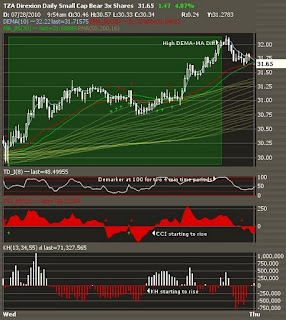
TZA was held throughout most of the day. The 5 minute TZA chart did not signal a buy for the first half of the day. The 4 minute chart signaled a buy during the 9:38 period. The market progressed upwards in a methodical fashion with occasional pullbacks (especially after the DEMA had moved up & away from the MA & EMA). It was elected to hold TZA for most of the day. TZA was sold during the 3:10PM time period, since: 1. the DEMA-MA spread had widened; 2. the Demarker topped out at 100 for 2 successive periods and 3. the mid-day consolidation period (with all the red and green arrows battling it out) lasted more than the 50 minutes that was left in the trading session. Could have had a slightly longer mid-day nap...

No comments:
Post a Comment