
Monday, April 30, 2012
9-21-9 today so far
A series of failed formulas resulting in recent bad calls. Today is a Red Reversal day
 signaled by a pink 5-24-5 on Friday. Today is a Brown (not light green) 9-21-9: more down 2moro. A variety of formulas favor a down rather than up day 2moro. Tally Ho!
Thursday, April 26, 2012

Wednesday, April 25, 2012
Futures are up, but...
One of the 29:26:29/31:20:10/31:20:31 fingerprints (Blue arrows on candlevolume chart) occurred on 9/29/11, 10/14/11, 10/18/11 & yesterday. An interesting signal rang yesterday: PROS SELLING ON HIGH VOLUME DAY WITH NARROW RANGE: MARKET WEAKNESS PRE-UPTHRUST.
1. 9/29/2011 (TNA close 36.32) (31:20:10). The next day: 9/30/2011 (TNA open 34.43, TNA high 36.09, TNA low & close: 33)
2. 10/14/2011 (TNA close 43.23) (29:26:29). The next day: 10/17/2011 (TNA open 42.09, TNA high 42.34, TNA low 38.74, TNA close 39.13)
3. 10/18/2011 (TNA close 42.39) (31:20:31). The next day: 10/19/2011 (TNA open 42.06, TNA high 43.05, TNA low 39.3, TNA close 40.08).


Tuesday, April 24, 2012

Monday, April 23, 2012
New Fingerprints
4:20:04: Not new...Reliably predicted big up day.
6:24:06: Was a Red Reversal
9:21:13: New Fingerprint that was followed by another down day.
10:19:10: Blown call. Turned out to be followed by a green pullback, rather than a red continuation.
11:20:02: No harm, since this fingerprint was followed by a big down day today. TZA positions were sold by 10AM.
27:21:08: Another new fingerprint today.


Thursday, April 19, 2012
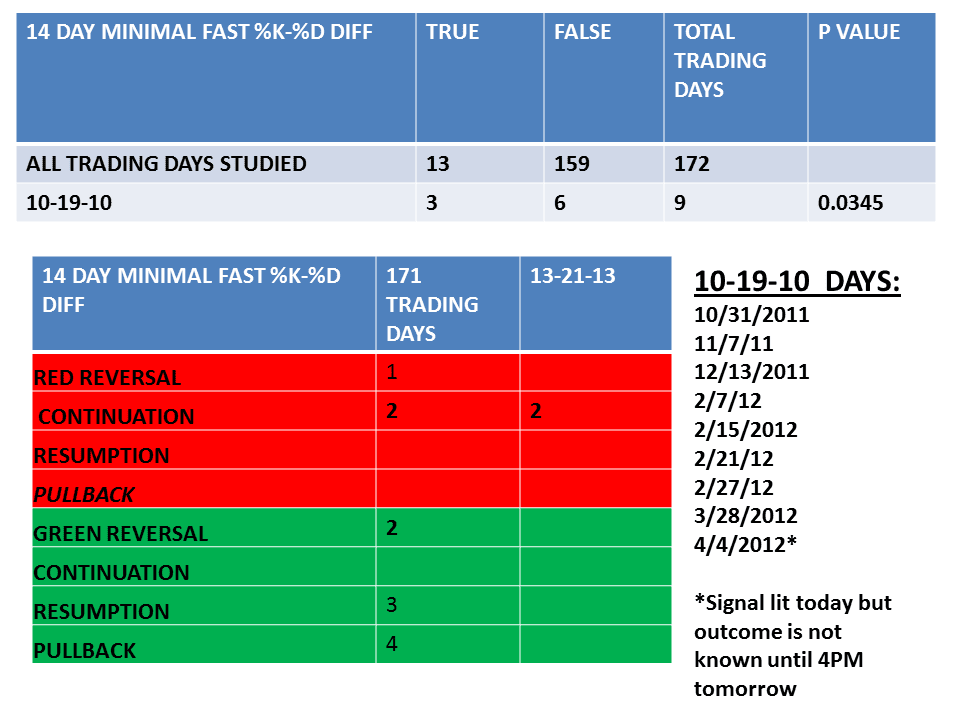
10-19-10 morphs into 4-20-4 so far
The 10-19-10 CMF/ 2 DAY HIGH-LOW DIFF DIFFERENTIATOR was TRUE earlier this morning suggesting that 2moro would be down. Next TNA rose. The fingerprint morphed into 4-20-4. If this holds...2moro may be a big up day based on the last 3 occurrences.
 Quick retreat back to 10-19-10...some downhill skiing...
 At 10-19-10 for a third time today...It is associated with a DeMark 3 Falling Closes today.


Wednesday, April 18, 2012
9-21-13???
Yesterday's 6-24-6 did predict a down day. Today's fingerprint morphed from a bidirectional 9-21-9 into a heretofore not seen 9-21-13.
1. Was the 6-24-6 predictive of a pullback or red reversal?
2. Where does the 9-21-13 take the market? Suspect more down...
 Juvenile Double Crested Cormorant seen at Gateway Marina 2 weeks ago.

Tuesday, April 17, 2012
6-24-6 Today
The last three 4-20-4's were followed by big up days. The 1st two 4-20-4 days were followed by 6-24-6. One day went up and the other went down. Otherwise,
 6-24-6 days are usually followed by a down day.

Monday, April 16, 2012
Late Day Rally Morphs Print into 4-20-4
Two 4-20-4 occurrences since last summer, both followed by up days.


Friday, April 13, 2012
9-21-9 Fingerprint Today
TNA exhibited the 9-21-9 fingerprint today.
TNA is exhibiting a Bearish Harami today. The latter satisfies part of the VU FORMULA = HI-LOW < PRIOR HI-LOW WITH CHAIKIN MONEY FLOW DROP also signalled for TNA today and on three other 9-21-9 days since last summer: 10/28/11, 11/4/11 & 2/6/12. The positive VU Formula/9-21-9 combo days were both followed by down days. 11/4/11 predicted a 2nd day TNA pullback day and also followed the 3:19:03, 11:20:11 & 6:24:06 fingerprint succession.
 Currently holding TZA while reviewing for additional "down 9-21-9" positive signals for TNA.

Thursday, April 12, 2012

6-24-6
Took TNA profits. 6-24-6 followed the two prior 3-19-3/11-20-11 fingerprint days. On 11/3/11 the 6-24-6 predicted the beginning of a 2 day pullback. On 12/16/11 the 6-24-6 also predicted a red pullback. So far today TNA is signalling RISING VOLUME NOT HITTING MAXIMAL HIGH which also occurred on 12/16/11.


Wednesday, April 11, 2012
11-20-11

Tuesday, April 10, 2012
3-19-3
3-19-3 AGAIN TODAY. 4/10/2012 REVERSE YUM-YUM, NEGATIVE WILDER MOMENTUM FACTORS, REVERSE 3DE, 14 DAY MAXIMAL RANGE RSI, CU FORMULA,3 NEGATIVE HA CLOSE - OPEN RANGES, and FALLING CLOSE, RISING RANGE & VOLUME all have the makings of a reversal.


Monday, April 9, 2012
So far: 3-19-3 Today
HA Range 13.63, So Far RW CANDLE, LARGE HA RED CANDLE: Suggests Green TNA Reversal 2moro.


Sunday, April 8, 2012
3-19-3 CANDLE & HA CANDLE ANALYSIS


Thursday, April 5, 2012
3-19-3 Today
This one can be a green reversal, green pullback or red continuation. Doubt that it is a green reversal since HA Range is only 2.09, whereas prior 3-19-3 Green Reversals had HA Ranges of 12.54, 22.07 & 34.95.
Be wise.


Wednesday, April 4, 2012
10-19-10 Fingerprint Today (Updated)


Tuesday, April 3, 2012
13-21-5 CONVERTS TO 13-21-13


13-21-5
When TNA is down for the day today's fingerprint is 13-21-5 (2 prior instances in past 170 trading days). When TNA rises above 0% for the day the fingerprint becomes 12-24-5 (3 prior instances in past 170 trading days). Each of those five days were followed by an up day.


Monday, April 2, 2012
2-20-2 GRID FINGERPRINT EOD


11-20-3 GRID has evolved into 2-20-2 GRID
Taking profits today since 2-20-2 can be either green continuation or red pullback day after a Green Reversal. The first number is the PVI 3LB GRID. The middle number (i.e. 20) is the PVI Demarkian GRID. The last number is the mode of all the 3LB GRIDS.

As of 10:30AM GRIDS Suggest More Up 2moro

Sunday, April 1, 2012
17:19:1/17:19:7=?3:19:3

Subscribe to:
Posts (Atom)
