Monday, August 30, 2010

No BLIP Detected & Weekly TZA ROC Crosses Up Over Zero


On an adventure. As of now: No BLIP Detected & Weekly TZA ROC crossed up over zero. If prices don't change radically today - would hold TZA overnight...See disclaimer above.

Sunday, August 29, 2010

TNA Mirror


CSI wanes in both directions as initial run-up (run-down) plays out. CSI goes back up for 2nd run...

Are the Bears Toast? May(27th)be not!


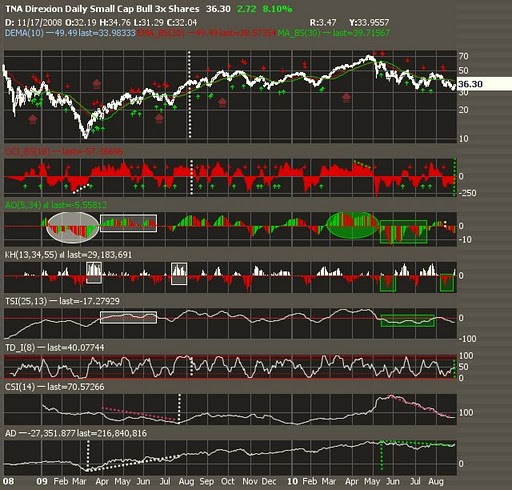
Similarities between May 27th and August 27th.


1. Downtrending DEMA (blue) greater than red EMA greater than green MA.
2. Downsloping CCI entering consolidative range.
3. Awesome oscillator positive and just went from green to red.
4. Declining Klinger Histogram
5. TSI just peaked in low teens
6. Consolidating saw-tooth AD.
7. NASI %B(5,2) curving up to 0.24
8. Mild NASI uptick (green arrow)
9. Bottoming, flat NASI RSI
10. Prior day with similar Peak TSI Product
Note: %B "tells us where we are in relation to the Bollinger Bands and is the key to the development of trading systems via the linking of price and indicator action." (p.60). %b will equal 1.0 when prices are at the upper Bollinger Band. It will equal 0.50 when prices are in the middle of the bands. And it will equal zero when prices are at the lower Bollinger Band. As John Bollinger suggests, %B can be easily used to create simple trading systems - for example "Buy when %B is below 0.1 and sell when %B is above 0.9." (from Stockcharts.com)

Please Interpret & Feel Free to Comment...

Weekly ROC & Blip Detection


As TZA trended up Weekly TZA ROC(6)& Blip Detection worked well to detect major moves within the trend.

Saturday, August 28, 2010

TZA, Weekly Chart Blip Detection Compared with...


Based on Weekly TZA Indicator-related BLIP DETECTION Elliot wave 1[v] was moved again on this TZA daily chart(from May 24th to July 5th). For this downwardly trending market, blip detection detected major TZA turning points better than weekly & daily Renko, weekly & daily 3 Line Break and weekly & daily Kagi.

Thanks Maurice...


Maurice Walker rekindled a burning question. Why was MINOR WAVE 2 so long? Better stated: Why such a short MINOR WAVE 3?


PRIMARY 3
INTERMEDIATE 1
MINOR 3
MINUTE [i]
Minuette v
Subminuette i will start Monday.

Friday, August 27, 2010

Expect Minor 3 Minute Wave [iv]b or Minor 3 Minute Wave [v] on Monday


FRI AUG 27TH
WAVE 3 [iii]v-[iv]a
TNA F2: 4
TZA F2: 27
ABS SUM: 31
TNA CLOSE: 36.3


PRIMARY 3
INTERMEDIATE 1
MINOR 3
MINUTE [iii]/[iv]
Minuette v/a(-c)
Subminuette 5/a-?

Check out Craig's count & Pokerden: http://www.focalequity.com/2010/08/27/craigs-count-strong-internals-got-a-bear-thinking/
http://spyswings.blogspot.com/2010/08/082710-update.html
Green Heron

$SPX Outcomes for NASI RENKO of -566 with CCI (20) of -158

Equivolume Charting of TNA’s Declines

Thursday, August 26, 2010

TZA, Bollinger Band Channels & Blips

Holding TZA overnight


THURS AUG 26th
WAVE 3[iii]ivc-v1
TNA F2: 0
TZA F2: -3
ABS SUM: 3 NO NEW BLIP DETECTED (CONTINUE TO HOLD TZA OVERNITE)
TNA CLOSE: 33.58


PRIMARY 3
INTERMEDIATE 1
MINOR 3
MINUTE [iii]
Minuette iv/v
Subminuette c/1
The lower TZA open was the market rallying (Minuette iv Subminuette c) and then it was TZA time again as Minuette v began. Here was the set-up for Minuette v: The TZA Demarker bottomed at the open. The CCI crossed up above -200 in the 9:34 AM period. The TSI bottomed in the 9:46 AM period. The TZA AD line turned up in the 10:06 AM period. The AO had a twin peaks signal & the KH crossed up above zero in conjunction with a rising TSI in the 10:18 AM period and Minuette v began. The MAs & CCI jumped aboard between 10:50 AM & 11:10 AM, as did the AO, which crossed up above the zero line. The SPX Renko closed in the red again with a CCI of -135.96.

Wednesday, August 25, 2010

ELLIOT WAVE and Trading Minuette iv Subminuette a or c


TUES AUG 24th
WAVE 3[iii]iii3-4
TNA F2: 2808
TZA F2: 662
ABS SUM: 3470
TNA CLOSE: 32.934

PRIMARY 3
INTERMEDIATE 1
MINOR 3
MINUTE [iii]
Minuette iii
Subminuette 3-4

WED AUG 25th
WAVE 3[iii]iii5-iv a or a-c
TNA F2: -1310
TZA F2: -13
ABS SUM: 1323...BLIP DETECTION: BUY OR HOLD TZA OVERNITE In Preparation for Minuette iv Subminuette b or Minuette v Subminuette 1
TNA CLOSE 34.49

PRIMARY 3
INTERMEDIATE 1
MINOR 3
MINUTE [iii]
Minuette iii/iv
Subminuette 5/a or a-c

A TZA leg demonstrated a CCI divergence (light blue dashed lines). This leg was either part of Minuette iv Subminuette a or it was Minuette iv Subminuette b. The TNA Demarker bottomed while TZA was running up & the divergence was being formed. The CCI went up above -100 during the 1:02 PM period and went up above 100 during the 1:42 PM period signalling a TNA Buy. This was supported by a bottoming of the TSI during the 1:26 PM period and the AD line during the 1:14 PM period. The Awesome Oscillator crossed above zero during the 1:50 PM period. A bottoming and a 3-period CSI rise was documented at 2:14 PM.

Tommorrow is THURS AUG 26th
Suspect we will have: WAVE 3[iii]iii 4 b-c or 5
0
0
0
0

PRIMARY 3
INTERMEDIATE 1
MINOR 3
MINUTE [iii]
Minuette iv or v
Subminuette b-c or 1-?

NASI & EW

Tuesday, August 24, 2010

Still Holding TZA


Suspect that Minor Wave 3(iii)iii 5 will play out tomorrow, F2 calculations will detect a blip and will sell TZA as Minor Wave 4 begins. The NASI Renko CCI is only at -79.49, suggesting more downward market activity (?Minor Wave 5).

Monday, August 23, 2010

Grand Supercycle Wave IV


From Ron Walker on Stockcharts.com and Kenny's Blog

Holding TZA overnight


We're in wave iii(iii)1 and the NASI RENKO CCI is not below -100 yet (see post below).

From Wiki

"Wave 3: Wave three is usually the largest and most powerful wave in a trend (although some research suggests that in commodity markets, wave five is the largest). The news is now positive and fundamental analysts start to raise earnings estimates. Prices rise quickly, corrections are short-lived and shallow. Anyone looking to "get in on a pullback" will likely miss the boat. As wave three starts, the news is probably still bearish, and most market players remain negative; but by wave three's midpoint, "the crowd" will often join the new bullish trend. Wave three often extends wave one by a ratio of 1.618:1."
This will happen to TZA (Target ~46)

30 MIN RENKO SPX, ELLIOT WAVE & BLIP DETECTION

NASI Renko & CCI Divergence


NASI & 8 Box Renko


A la Matthew Frailey at stockcharts.com

Sunday, August 22, 2010

What's Up With the Trin?


The TRIN punched up through the cloud in September 2008 & June 2010. The Weekly Renko has been bullish for TRIN (bear market) for years. The daily & weekly Kagi charts are TRIN bullish. The daily & weekly 3 Line Break charts are also TRIN bullish.

What's Up With the VIX?


The VIX remains below the cloud. The daily Renko, daily Kagi and daily & weekly 3 Line Break charts are VIX Bullish (bearish for the market).

ICHIMOKU EQUIVOLUME BLIP DETECTION


July & August is wider on the TZA than the TNA chart because of larger equivolume boxes. Daily Chart TZA Buy Blip Detection (green arrows are shown) along with Daily Chart TNA Buy Blip Detection (red arrows). In July & August TNA has been trading below its wide red (bearish) cloud and TZA has been trading within, below and then within its thin green (bullish) cloud. TNA was turned back down three times at the base of its cloud (last 3 green arrows on the TNA chart). TZA was turned back down once at the top of its cloud (red arrow). TZA is breaking up through its cloud. This appears to coincide with Elliot Wave Minor 3 [iii] (ii). A big TZA breakout may happen real soon...

Saturday, August 21, 2010

Volume Divergence ahead of Major Decline

TZA ROC Buy Signal

BLIP Detection on the Daily TZA Kagi Chart

BLIPS & the TZA Weekly Equivolume Chart

TZA ELLIOT WAVE COUNT

F2 BLIP DETECTION & WEEKLY TZA KAGI CHART

F2 BLIP DETECTION & TZA WEEKLY CHART


TZA was falling in March. A Sell TZA BLIP (series 3 green 3D line) was detected early (3rd Week Of March). This was in conjuction with the bottoming of the Demarker. The TSI (True Strength Index) bottomed in the last week of April. The CCI crossed up above -100, which signaled a TZA Buy. This was confirmed by the KH (Klinger Histogram) crossing up above zero in conjuction with the rising TSI. A Sell TZA BLIP was detected in the 4th week of May (red arrow). This preceded the Declining KH Sell Signal in the first week of June. The low CCI values suggested a consolidation (blue rectangle). The Demarker rose and peaked during the 2nd week of June. The Demarker remained high & flat as a new blip was detected in the 3rd week of June. This BLIP signaled a new TZA Buy. Because of insufficient data on the weekly chart the CSI is not used in Formula 2 (F2) calculations on the weekly analysis. The TZA Buy was confirmed by the uptick in the CCI over 100 (green dashed line). The Demarker began to fall and a sell TZA BLIP (red arrow) was detected in the 1st week of July. This was confirmed by a drop in the CCI below 100 (white dashed line), an interim peak in the TSI and the KH (white oval). The Demarker & TSI resumed their rises during the 1st week of August a TZA Buy BLIP was detected as of yesterday (3rd week of August). This was confirmed by the KH (green oval) in conjunction with the rising TSI.